1. 前言
基因组Circos图基本上是每个基因组研究必备的,但是优雅的绘制一个“不普通的Circos图呢”?所以今天来记录一下自己绘制基因组Circos图的过程。
2. 数据准备
这部分有一些原始结果可以通过不同的软件得到,重复序列的gff文件我通过EDTA,基因的表达量数据我通过nf-core/rna-seq,共线性我通过jcvi
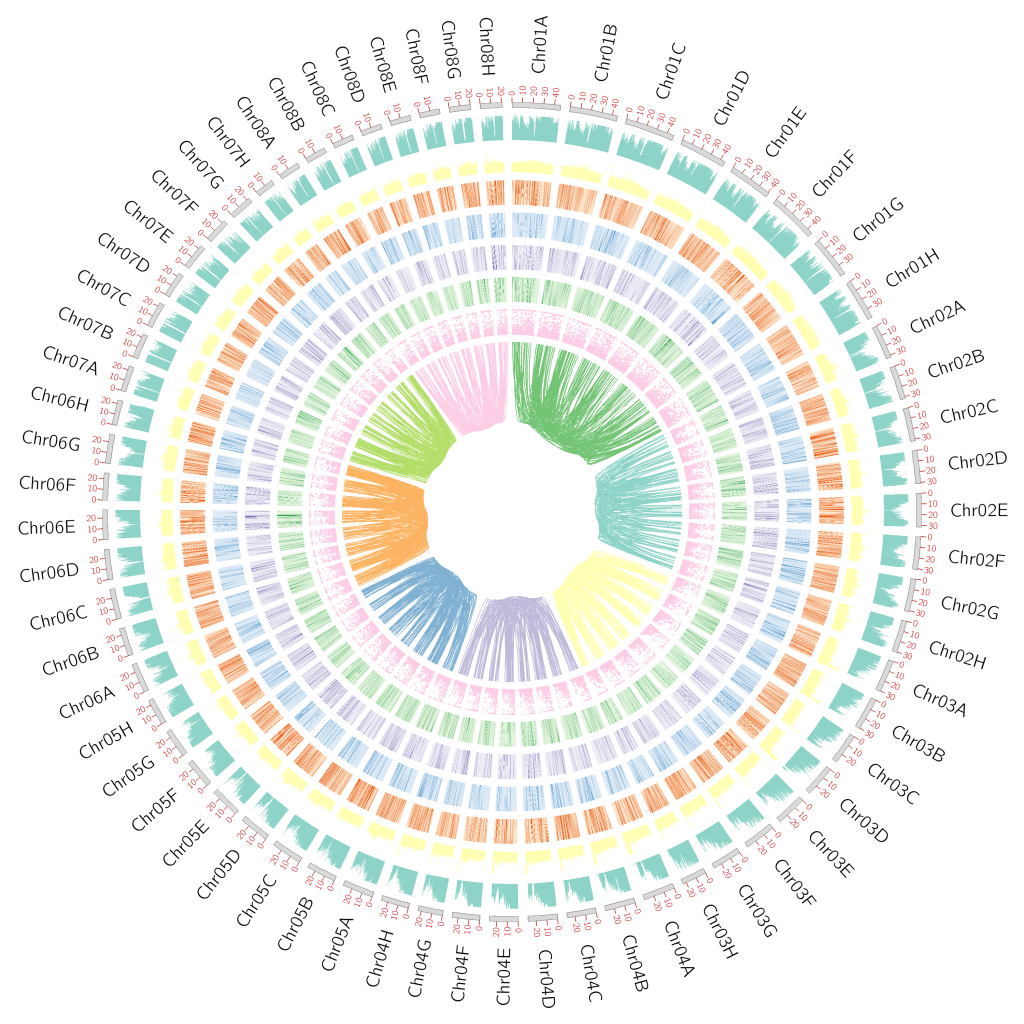
(1)基因组的长度信息
(2)GC含量
(3)基因密度
(4)重复序列密度
(5)DNA反转座子密度
(6)Copia密度
(7)Gypsy密度
(8)LTR密度
(9)共线性Link
(10)基因表达量密度
					## 计算染色体长度
seqtk comp  genome.fasta|awk '{print $1"\t"$2}' > genome.len
## 生成染色体文件 7列
awk '{print "chr\t-\t"$1"\t"$1"\t0\t"$2"\tchr"NR}' genome.len > Sind_karyotype.txt
## 生成窗口文件, 窗口大小50Kb
bedtools  makewindows -w 50000 -g  genome.len > genome.window.bed
## 计算基因密度
bedtools intersect  -a genome.window.bed -b Sind.bed -c -F 0.1  > Sind_genecount.txt
## 计算每个窗口平均GC含量
seqtk subseq genome.fasta  genome.window.bed  > genome.window.fasta
seqtk comp  genome.window.fasta |awk '{print $1 "\t" ($4+$5)/($3+$4+$5+$6) } ' |awk -F ":|-" '{print $1"\t"$2"\t"$3"\t"$4}'> Sind_gc.txt
## 计算每个窗口重复序列含量
grep "LTR" ../Anno/quarTeT.genome.filled.fasta.mod.EDTA.intact.gff3 > quarTeT.genome.filled.fasta.repeat.LTR.gff
grep "Copia" ../Anno/quarTeT.genome.filled.fasta.mod.EDTA.intact.gff3 > quarTeT.genome.filled.fasta.repeat.Copia.gff
grep "DNA" ../Anno/quarTeT.genome.filled.fasta.mod.EDTA.intact.gff3 > quarTeT.genome.filled.fasta.repeat.DNA.gff
grep "Gypsy" ../Anno/quarTeT.genome.filled.fasta.mod.EDTA.intact.gff3 > quarTeT.genome.filled.fasta.repeat.Gypsy.gff
bedtools coverage -a  genome.window.bed -b  quarTeT.genome.filled.fasta.repeat.Copia.gff |awk '{print $1 "\t" $2 "\t" $3 "\t" $7}' > Repeat_Copia.txt
bedtools coverage -a  genome.window.bed -b  quarTeT.genome.filled.fasta.repeat.DNA.gff |awk '{print $1 "\t" $2 "\t" $3 "\t" $7}' > Repeat_DNA.txt
bedtools coverage -a  genome.window.bed -b  quarTeT.genome.filled.fasta.repeat.Gypsy.gff |awk '{print $1 "\t" $2 "\t" $3 "\t" $7}' > Repeat_Gypsy.txt
bedtools coverage -a  genome.window.bed -b  quarTeT.genome.filled.fasta.repeat.LTR.gff |awk '{print $1 "\t" $2 "\t" $3 "\t" $7}' > Repeat_LTR.txt
bedtools coverage -a  genome.window.bed -b  repeat.gff |awk '{print $1 "\t" $2 "\t" $3 "\t" $7}' > Repeat.txt
## 基于jcvi结果生成共线性link文件
perl get_jcvi_block.pl  Sind.bed  Sind.Sind.anchors 8  >  Sind_links.txt
## 计算基因表达量密度
python merge_tpm_to_bed.py -b Prunus_pedunculata_Chr_gene.bed -t salmon.merged.gene_tpm.tsv -o Prunus_pedunculata_Chr_gene_TPM.bed
bedtools map -a /home/majunpeng/sda2/Biantao_Sequence_data/Circos/genome.window.bed -b /home/majunpeng/sda2/Biantao_Sequence_data/Circos/Prunus_pedunculata_Chr_gene_TPM.bed -c 5 -o sum -null 0 > /home/majunpeng/sda2/Biantao_Sequence_data/Circos/gene_expression_sum_in_windows.bed
3. 绘制Circos图
准备三个配置文件(1)circos.conf,主配置文件(2)ideogram.conf,染色体骨架配置文件(3)ticks.conf,染色体骨架刻度文件夹
					<ideogram>

##设定染色体间的空隙大小

<spacing>
default = 0.005r #设置圈图中染色体之间的空隙大小,以下设置为每个空隙大小为周长的1%

</spacing>

radius = 0.8r #设定 ideograms 的位置,以下设定 ideograms 在离圆心的 90% 处
thickness = 15p #设定 ideograms 的厚度为10p
fill = yes #设定ideograms是否填充颜色。

stroke_color = dgrey #设置轮廓颜色
stroke_thickness = 1p #设置轮廓厚度

show_label = yes #设定是否显示label, 对应着karyotype文件的第4列。
label_radius = 1.07r #设定 label 的位置
label_font = default #设置字体
label_size = 40p #设定label的字体大小
label_parallel = no #设定label的文字方向,yes表示平行于染色体。

</ideogram>
					<ticks>

radius = 1r  #设定 ticks 的位置
color = vdred # 设定 ticks 的颜色
thickness = 2p # 设定 ticks 的厚度

multiplier = 1e-6 # 设定 ticks label 的值的计算。将该刻度对应位置的值 * multiplier 得到圈图上的label 值。
orientation = out # 设定ticks向外还是向内 可以设置值为 out 和 in
format = %d # label值的格式化方式。%d 表示结果为整数;%f 结果为浮点数; %.1f 结果为小数点后保留1位.

<tick>
spacing = 10u # 设置每个刻度代表的长度。
size = 15p  # 设置 tick 的长度

show_label = yes #设置展示 ticks label。
label_size = 20p #设置 ticks label 的字体大小
label_offset = 5p #设置 ticks label 离 ticks 的距离
format = %d
</tick>

</ticks>
karyotype = Sind_karyotype.txt #指定染色体文件
chromosomes_units = 1000000  #设置长度单位,表示为1M长度的序列代表为1u
chromosomes_display_default = yes #默认是将所有的染色体都展示出来

##载入ideogram配置和刻度线配置

<<include ideogram.conf>>
show_ticks          = yes # 显示刻度
show_tick_labels    = yes # 显示刻度label
<<include ticks.conf>>


##plots block 绘制折线图、散点图、直方图、热图和文本显示
<plots>

##绘制直方图
<plot>
type = histogram # histogram指定绘制直方图 line为折线图,scatter为散点图,heatmap为热图,text为文本
file = Sind_genecount.txt #文件路径
# 设置直方图的位置,r1 > r0
r1 = 0.98r
r0 = 0.92r
orientation = out #直方图方向,in为向内
fill_color = set3-8-qual-1 #直方图的填充颜色
thickness = 0p
max = 10

# 设定直方图的背景颜色
<backgrounds>
<background>
color = vvvlgrey
</background>
</backgrounds>

</plot>

<plot>
type = histogram # histogram指定绘制直方图 line为折线图,scatter为散点图>,heatmap为热图,text为文本
file = Sind_gc.txt #文件路径
# 设置直方图的位置,r1 > r0
r1 = 0.90r
r0 = 0.84r
orientation = out #直方图方向,in为向内
fill_color = set3-8-qual-2 #直方图的填充颜色
thickness = 0p

# 设定直方图的背景颜色
<backgrounds>
<background>
color = vvvlgrey
</background>
</backgrounds>

</plot>

<plot>
type = heatmap # histogram指定绘制直方图 line为折线图,scatter为散点图>,heatmap为热图,text为文本
file = Sind_repeat_LTR.txt #文件路径
# 设置直方图的位置,r1 > r0
r1 = 0.82r
r0 = 0.76r
color = oranges-3-seq #热图的颜色
max = 0.1

# 设定直方图的背景颜色
<backgrounds>
<background>
color = vvvlgrey
</background>
</backgrounds>

</plot>

<plot>
type = heatmap # histogram指定绘制直方图 line为折线图,scatter为散点图>,heatmap为热图,text为文本
file = Sind_repeat_Gypsy.txt #文件路径
# 设置直方图的位置,r1 > r0
r1 = 0.74r
r0 = 0.68r
color = blues-3-seq #热图的颜色
max = 0.1

# 设定直方图的背景颜色
<backgrounds>
<background>
color = vvvlgrey
</background>
</backgrounds>

</plot>

<plot>
type = heatmap # histogram指定绘制直方图 line为折线图,scatter为散点图>,heatmap为热图,text为文本
file = Sind_repeat_Copia.txt #文件路径
# 设置直方图的位置,r1 > r0
r1 = 0.66r
r0 = 0.60r
color = purples-3-seq #热图的颜色
max = 0.1

# 设定直方图的背景颜色
<backgrounds>
<background>
color = vvvlgrey
</background>
</backgrounds>

</plot>

<plot>
type = heatmap # histogram指定绘制直方图 line为折线图,scatter为散点图>,heatmap为热图,text为文本
file = Sind_repeat_DNA.txt #文件路径
# 设置直方图的位置,r1 > r0
r1 = 0.58r
r0 = 0.52r
color = greens-3-seq #热图的颜色
max = 0.1

# 设定直方图的背景颜色
<backgrounds>
<background>
color = vvvlgrey
</background>
</backgrounds>

</plot>

<plot>
type  = scatter # 指定绘图类型为line
file  = gene_expression_sum_in_windows.bed # 设定数据文件路径
# 设定图形所处位置
r1    = 0.50r
r0    = 0.44r
glyph =  circle # circle, rectangle, or triangle
glyph_size = 4p # 点大小
color = set3-8-qual-8  # 点图的颜色
max = 100

<backgrounds>
<background>
color = vvvlgrey
</background>
</backgrounds>

</plot>

</plots>

##links画连接线
<links>

<link>
file = Sind_links_homologous_only.txt
color = set3-8-qual-4  #设置颜色
radius = 0.42r  #设置 link 曲线的半径
bezier_radius = 0r #设置贝塞尔曲线半径,该值设大后曲线扁平。
thickness = 2 #设置 link 曲线的厚度

## ribbon = yes  #将线条连接改成带状连接

## 这里添加了一个函数,自定义每个同源染色体组的染色体之间的的Link线为一个颜色
<rules>

<rule>

   condition  = on(Chr01g1) || on(Chr01g2) || on(Chr01g3) || on(Chr01g4) || on(Chr01g5) || on(Chr01g6) || on(Chr01g7) || on(Chr01g8)
   color = green

</rule>

<rule>

   condition  = on(Chr02g1) || on(Chr02g2) || on(Chr02g3) || on(Chr02g4) || on(Chr02g5) || on(Chr02g6) || on(Chr02g7) || on(Chr02g8)
   color = set3-8-qual-1

</rule>

</rule>

<rule>

   condition  = on(Chr02g1) || on(Chr02g2) || on(Chr02g3) || on(Chr02g4) || on(Chr02g5) || on(Chr02g6) || on(Chr02g7) || on(Chr02g8)
   color = set3-8-qual-1

</rule>

<rule>

   condition  = on(Chr03g1) || on(Chr03g2) || on(Chr03g3) || on(Chr03g4) || on(Chr03g5) || on(Chr03g6) || on(Chr03g7) || on(Chr03g8)
   color = set3-8-qual-2

</rule>

<rule>

   condition  = on(Chr04g1) || on(Chr04g2) || on(Chr04g3) || on(Chr04g4) || on(Chr04g5) || on(Chr04g6) || on(Chr04g7) || on(Chr04g8)
   color = set3-8-qual-3

</rule>

<rule>

   condition  = on(Chr05g1) || on(Chr05g2) || on(Chr05g3) || on(Chr05g4) || on(Chr05g5) || on(Chr05g6) || on(Chr05g7) || on(Chr05g8)
   color = set3-8-qual-5

</rule>

<rule>

   condition  = on(Chr06g1) || on(Chr06g2) || on(Chr06g3) || on(Chr06g4) || on(Chr06g5) || on(Chr06g6) || on(Chr06g7) || on(Chr06g8)
   color = set3-8-qual-6

</rule>

<rule>

   condition  = on(Chr07g1) || on(Chr07g2) || on(Chr07g3) || on(Chr07g4) || on(Chr07g5) || on(Chr07g6) || on(Chr07g7) || on(Chr07g8)
   color = set3-8-qual-7

</rule>

<rule>

   condition  = on(Chr08g1) || on(Chr08g2) || on(Chr08g3) || on(Chr08g4) || on(Chr08g5) || on(Chr08g6) || on(Chr08g7) || on(Chr08g8)
   color = set3-8-qual-8

</rule>


</rules>

</link>

</links>


##以下部分通常不做修改
#设置图片参数
<image>
<<include etc/image.conf>>
#覆盖原来的图片半径参数
#radius* = 500
</image>

#设置颜色,字体,填充模式的配置信息:
<<include etc/colors_fonts_patterns.conf>>
#系统与debug参数:
<<include etc/housekeeping.conf>>