使用Circos绘制图形泛基因组的圈图
1. 前言
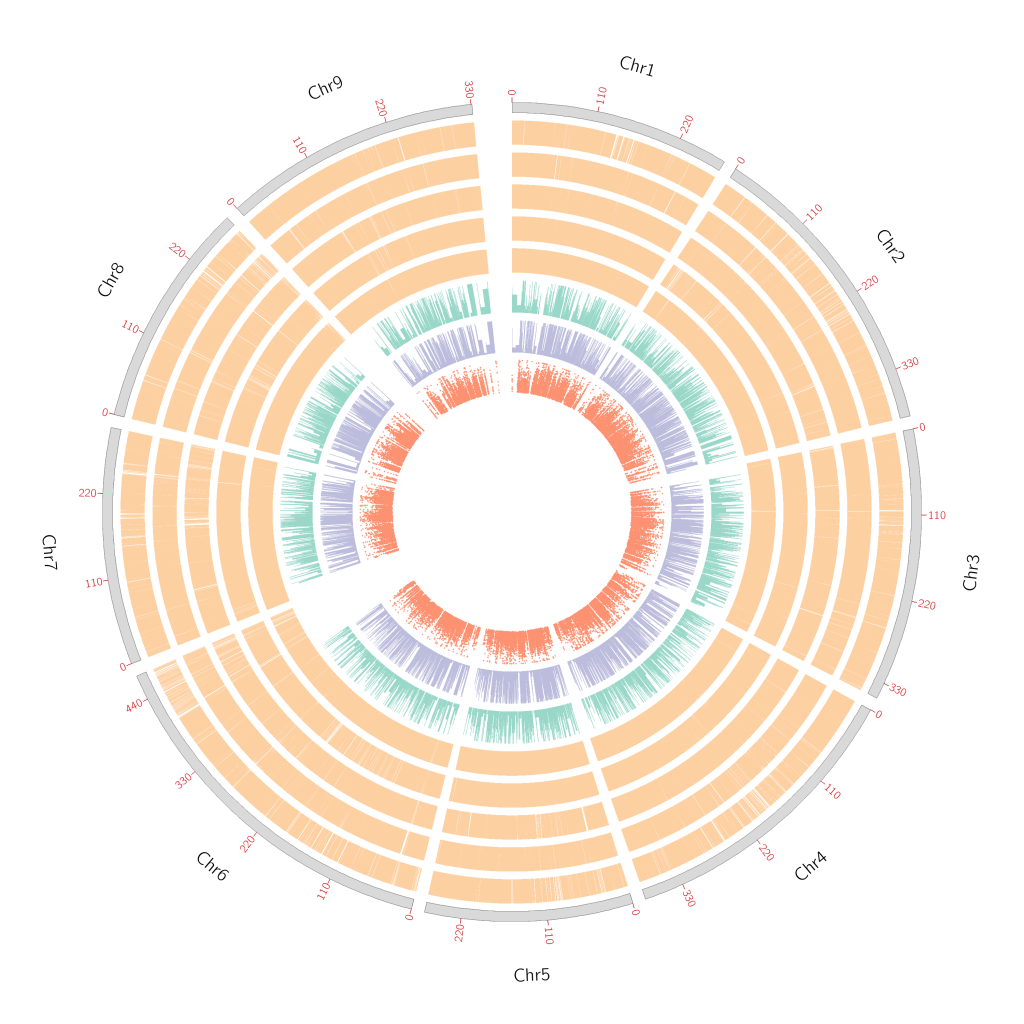
最近刚刚构完图形泛基因组,看了很多文章中都有图形泛基因组的circos图,自己也试着来是用我自己的数据来复刻一个。
2. 数据准备
(1)每个基因组与参考基因组之间的共线性文件
(2)图形泛基因组SNP的分布
(3)图形泛基因组的大SV和小SV的分布
(4)circos 绘图需求的基础文件
2.1 共线性分文件
这里需要注意的是,Circos中绘制基因组之间共线性常用的link函数,并不适合用在图泛的圈图里,因为不能设置半径的起点和重点,所以这里选择以窗口的形式统计共线性区域的分布,最后使用histogram函数进行柱状图的绘制,从而达到相同的效果。
# 共线性的结果选择fixchr的统计结果
awk ‘{print $10, $1, $2, $11, $3, $4}’ Species_alignments.txt|awk ‘$1 == $4’|awk ‘{print $1, $2, $3}’ > Spe
cies_Syn.txt
# 统计每个窗口的共线性分布
python3 coverage_window.py -i Species_Syn.txt -o Species_Syn_window.txt -w 50000
# 至此结束,Species_Syn_window.txt就是我们要绘制共线性分布的柱状图文件
2.2 & 2.3 计算SNP和SV分布
这里的思路就是从Cactus-pangenoe的结果vcf文件中分离出来SV和SNP,然后进行窗口的SNP数量统计。
# 从VCF文件中拆分SNP、large SV和samll SV,输出结果会有三个文件,分别对应三种的VCF
python Get_SV_VCF.py -i Chr_1.vcf -o Chr_1
# -o 输出结果的前缀
# 窗口计算
python Get_SV_count_circos.py Combine_SNP.vcf Circos_Combine_SNP.txt
python Get_SV_count_circos.py Combine_SV_large.vcf Circos_Combine_SV_large.txt
python Get_SV_count_circos.py Combine_SV_samll.vcf Circos_Combine_SV_samll.txt
2.4 Circos绘图
不说废话直接上Ciscos的绘图代码,看不懂自己去网上补课吧
karyotype = Genome_karyotype.txt #指定染色体文件
chromosomes_units = 1000000 #设置长度单位,表示为1M长度的序列代表为1u
chromosomes_display_default = yes #默认是将所有的染色体都展示出来
##载入ideogram配置和刻度线配置
<<include ideogram.conf>>
show_ticks = yes # 显示刻度
show_tick_labels = yes # 显示刻度label
<<include ticks.conf>>
##plots block 绘制折线图、散点图、直方图、热图和文本显示
<plots>
##绘制直方图
<plot>
type = histogram # histogram指定绘制直方图 line为折线图,scatter为散点图,heatmap为热图,text为文本
file = Genome_genecount.txt #文件路径
# 设置直方图的位置,r1 > r0
r1 = 0.98r
r0 = 0.92r
orientation = out #直方图方向,in为向内
fill_color = set3-8-qual-1 #直方图的填充颜色
thickness = 0p
max = 10
# 设定直方图的背景颜色
<backgrounds>
<background>
color = vvvlgrey
</background>
</backgrounds>
</plot>
<plot>
type = histogram # histogram指定绘制直方图 line为折线图,scatter为散点图>,heatmap为热图,text为文本
file = Genome_gc.txt #文件路径
# 设置直方图的位置,r1 > r0
r1 = 0.90r
r0 = 0.84r
orientation = out #直方图方向,in为向内
fill_color = set3-8-qual-2 #直方图的填充颜色
thickness = 0p
# 设定直方图的背景颜色
<backgrounds>
<background>
color = vvvlgrey
</background>
</backgrounds>
</plot>
<plot>
type = histogram # histogram指定绘制直方图 line为折线图,scatter为散点图>,heatmap为热图,text为文本
file = Genome_repeat_LTR.txt #文件路径
# 设置直方图的位置,r1 > r0
r1 = 0.82r
r0 = 0.76r
orientation = out #直方图方向,in为向内
fill_color = set3-8-qual-3 #直方图的填充颜色
thickness = 0p
# 设定直方图的背景颜色
<backgrounds>
<background>
color = vvvlgrey
</background>
</backgrounds>
</plot>
<plot>
type = histogram # histogram指定绘制直方图 line为折线图,scatter为散点图>,heatmap为热图,text为文本
file = Genome_repeat_Gypsy.txt #文件路径
# 设置直方图的位置,r1 > r0
r1 = 0.74r
r0 = 0.68r
orientation = out #直方图方向,in为向内
fill_color = set3-8-qual-5 #直方图的填充颜色
thickness = 0p
# 设定直方图的背景颜色
<backgrounds>
<background>
color = vvvlgrey
</background>
</backgrounds>
</plot>
<plot>
type = histogram # histogram指定绘制直方图 line为折线图,scatter为散点图>,heatmap为热图,text为文本
file = Genome_repeat_Copia.txt #文件路径
# 设置直方图的位置,r1 > r0
r1 = 0.66r
r0 = 0.60r
orientation = out #直方图方向,in为向内
fill_color = set3-8-qual-6 #直方图的填充颜色
thickness = 0p
# 设定直方图的背景颜色
<backgrounds>
<background>
color = vvvlgrey
</background>
</backgrounds>
</plot>
<plot>
type = histogram # histogram指定绘制直方图 line为折线图,scatter为散点图>,heatmap为热图,text为文本
file = Genome_repeat_DNA.txt #文件路径
# 设置直方图的位置,r1 > r0
r1 = 0.58r
r0 = 0.52r
orientation = out #直方图方向,in为向内
fill_color = set3-8-qual-7 #直方图的填充
thickness = 0p
# 设定直方图的背景颜色
<backgrounds>
<background>
color = vvvlgrey
</background>
</backgrounds>
</plot>
<plot>
type = scatter # 指定绘图类型为line
file = Genome_RNA_seq.txt # 设定数据文件路径
# 设定图形所处位置
r1 = 0.50r
r0 = 0.44r
glyph = circle # circle, rectangle, or triangle
glyph_size = 4p # 点大小
color = set3-8-qual-8 # 设定颜色
max = 10000
<backgrounds>
<background>
color = vvvlgrey
</background>
</backgrounds>
</plot>
</plots>
##links画连接线
<links>
<link>
file = Chrysanthemum_rhombifolium_filter_link.txt
color = set3-8-qual-4 #设置颜色
radius = 0.42r #设置 link 曲线的半径
bezier_radius = 0r #设置贝塞尔曲线半径,该值设大后曲线扁平。
thickness = 3 #设置 link 曲线的厚度
## ribbon = yes #将线条连接改成带状连接
</link>
</links>
##以下部分通常不做修改
#设置图片参数
<image>
<<include etc/image.conf>>
#覆盖原来的图片半径参数
#radius* = 500
</image>
#设置颜色,字体,填充模式的配置信息:
<<include etc/colors_fonts_patterns.conf>>
#系统与debug参数:
<<include etc/housekeeping.conf>>