1. 引言
多个基因组之间的共线性分析和可视化是基因组学重要的分析,目前能够完成上述工作的是Syri+Plotsr,但其实还有另外一个软件“GenomeSyn” 也能完成这个分析,此外可以添加GC含量、基因密度、TE密度、端粒和着丝粒等信息,对于展示TET基因组的组装于不同版本基因组的比较有很大的利用空间。
2. 软件下载
GenomeSyn主要基于MUMmer的比对结果进行共线性分析,所以除了下载GenomeSyn还需要下载MUMer。
					# 下载并安装MUMmer
wget https://github.com/mummer4/mummer/releases/download/v4.0.0beta2/mummer-4.0.0beta2.tar.gz
tar -xvzf mummer-4.0.0beta2.tar.gz
current_path='pwd'
cd mummer-4.0.0beta2
./configure --prefix=`pwd`
make
export PATH=$current_path/mummer-4.0.0beta2:$PATH

# 下载GenomeSyn
git clone https://github.com/JM-SONG/GenomeSyn.git

# 添加GenomeSyn环境变量,只要新打开一个终端,就要运行一次
source ./install.sh
3. 共线性分析并绘图
准备输入文件
1. 基因组文件(必须)
2. 端粒信息文件(可选)
3. 着丝粒信息文件(可选)
4. TE密度信息文件(可选)
5. 基因密度信息文件(可选)
6. GC含量文件(文件)
					# 基因组比对
minimap2 quarTeT.genome.filled.fasta Cucumber.CLv4_chr.fa -t 10 > minimap.paf
# 统一同源染色体ID,只需要调整Query的染色体ID和Reference一致即可
python ~/Script/syri/adjust_query_by_paf.py -p minimap.paf -q Cucumber.CLv4_chr.fa -o Rename_Cucumber.CLv4_chr.fa

# -p 比对的paf文件
# -q 需要重命名的基因组文件
# -o 重命名之后的基因组文件

# 排序
seqkit sort -n Rename_Cucumber.CLv4_chr.fa > Sort_Rename_Cucumber.CLv4_chr.fa
接下来准备端粒和着丝粒信息文件,格式如下
| Chr1 | 24645000 | 26520000 | . | centromere |
|---|---|---|---|---|
| Chr2 | 19330000 | 20545000 | . | centromere |
| Chr3 | 13415000 | 18360000 | . | centromere |
| Chr4 | 14010000 | 17430000 | . | centromere |
| Chr5 | 1 | 19410000 | 23560000 | centromere |
| Chr6 | 1 | 22805000 | 29535000 | centromere |
| Chr7 | 7435000 | 12440000 | . | centromere |
| Chr1 | 1 | . | . | Telomere |
|---|---|---|---|---|
| Chr1 | 46019285 | . | . | Telomere |
| Chr2 | 1 | . | . | Telomere |
| Chr2 | 37962012 | . | . | Telomere |
| Chr3 | 1 | . | . | Telomere |
| Chr3 | 37397937 | . | . | Telomere |
| Chr4 | 1 | . | . | Telomere |
| Chr4 | 45902961 | . | . | Telomere |
| Chr5 | 1 | . | . | Telomere |
| Chr5 | 38999019 | . | . | Telomere |
| Chr6 | 1 | . | . | Telomere |
| Chr6 | 42086491 | . | . | Telomere |
| Chr7 | 1 | . | . | Telomere |
| Chr7 | 29972313 | . | . | Telomere |
共线性分析并绘图
最简单的运行方式,只提供两个基因组,由GenomeSyn调用MUMmer进行比对,并且绘制共线性图。
GenomeSyn -g1 Rename_Cucumber.CLv4_chr.fa -g2 quarTeT.genome.filled.fasta
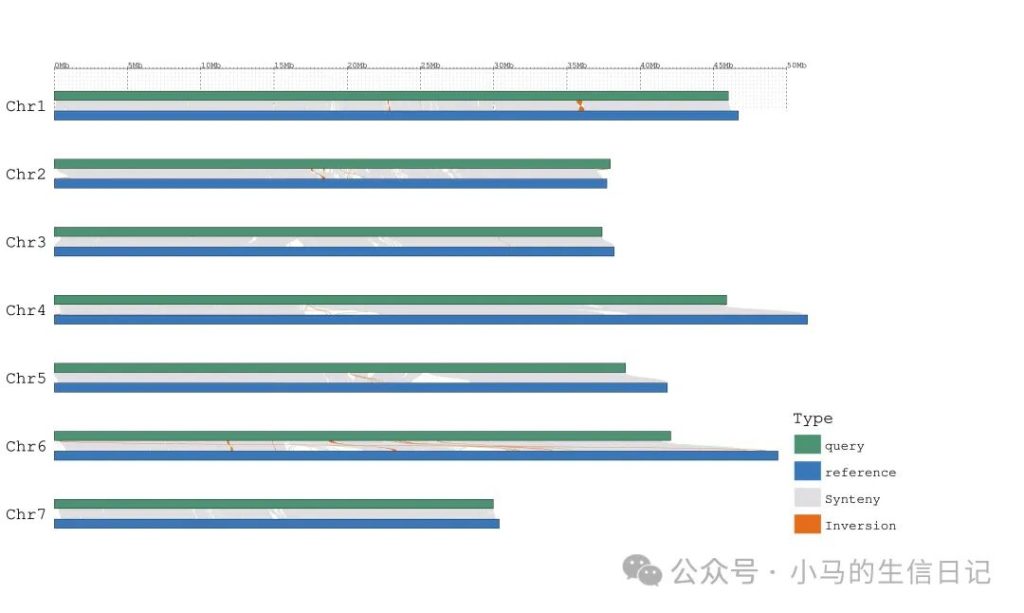
由于需要比对,所以运行的时间较长,结束后输出的.pdf和.svg文件就是结果图,.coords就是MUMmer的比对结果,后续运行直接提供.coords即可,可以省去比对的时间。
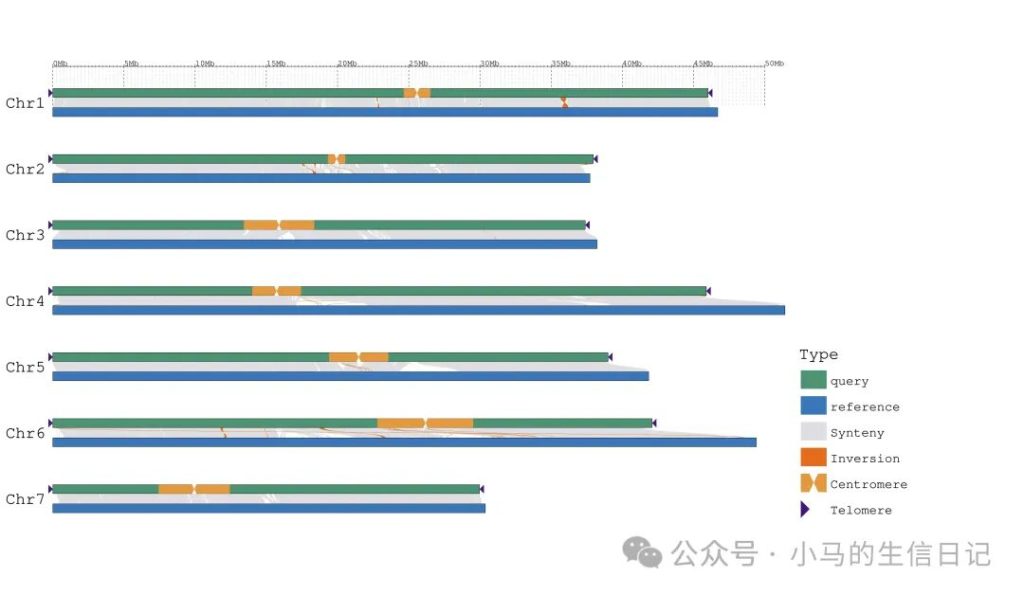
GenomeSyn还可以对端粒和着丝粒进行可视化。
					GenomeSyn -g1 Rename_Cucumber.CLv4_chr.fa -g2 quarTeT.genome.filled.fasta -cf1 MUMmer.delta.filter.coords -cen2  GenomeSyn_centi.bed -tel2 GenomeSyn_telo.bed

# -cf1 MUMmer的比对结果
# -cen2 -g2提供的基因组的着丝粒信息
# -tel2 -g2提供的基因组的端粒信息
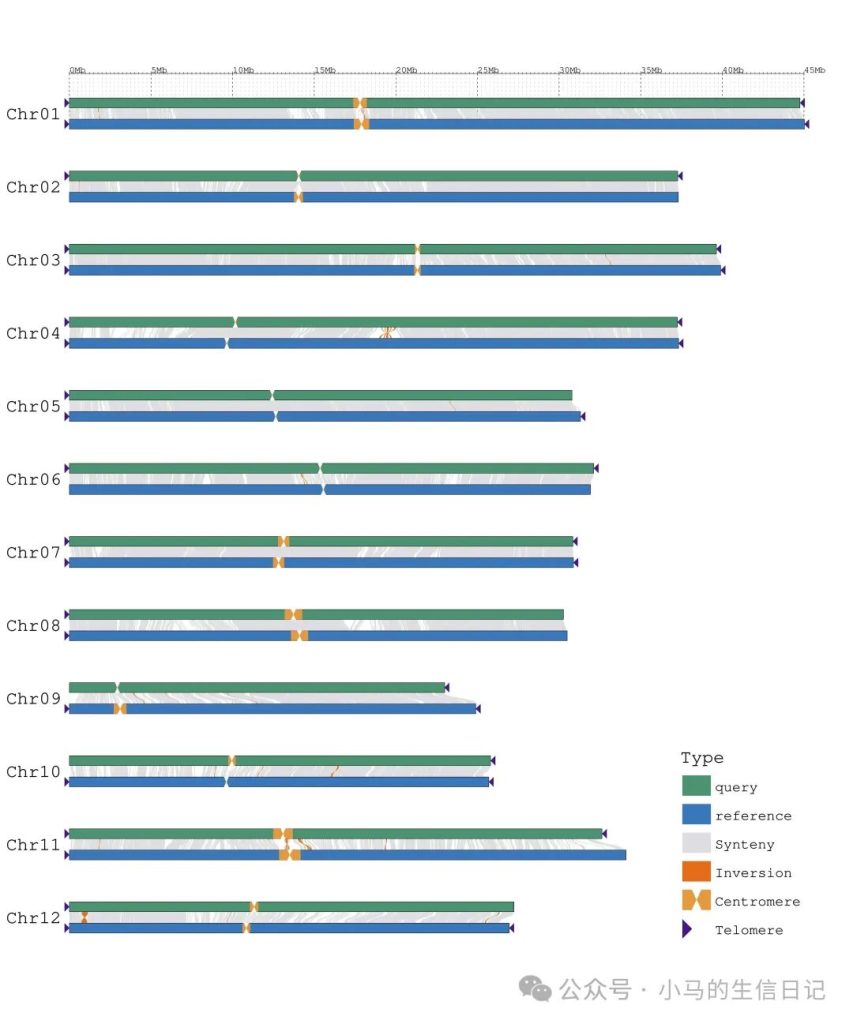
同样可以提供多个基因组的端粒信息和着丝粒信息并且进行可视化。
					GenomeSyn -g1 rice_MH63.fa -g2 rice_ZS97.fa -cf1 rice_MH63vsZS97.delta.filter.coords -cen1 rice_MH63_centromere.bed -tel1 rice_MH63_telomere.bed  -o1 Only_genome_add_Telomere_Centromere.svg -cen2 rice_ZS97_centromere.bed -tel2 rice_ZS97_telomere.bed

# -cf1 MUMmer的比对结果
# -cen1 -g1提供的基因组的着丝粒信息
# -tel1 -g1提供的基因组的端粒信息
# -cen2 -g2提供的基因组的着丝粒信息
# -tel2 -g2提供的基因组的端粒信息
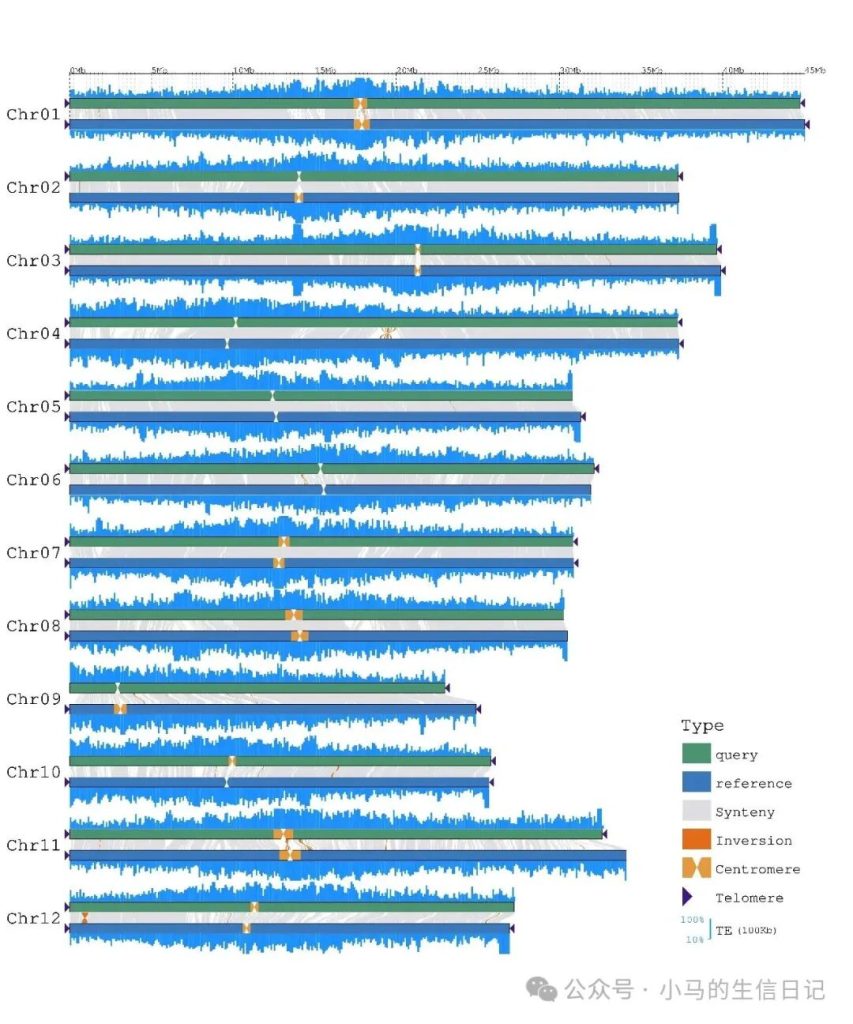
继续添加TE密度信息。
					GenomeSyn -g1 rice_MH63.fa -g2 rice_ZS97.fa \
-cf1 rice_MH63vsZS97.delta.filter.coords \
-cen1 rice_MH63_centromere.bed -tel1 rice_MH63_telomere.bed \
-o1 Only_genome_add_Two_Telomere_Centromere_TE.svg \
-cen2 rice_ZS97_centromere.bed -tel2 rice_ZS97_telomere.bed \
-TE1 rice_MH63_repeat.bed -TE2 rice_ZS97_repeat.bed

# -cf1 MUMmer的比对结果
# -cen1 -g1提供的基因组的着丝粒信息
# -tel1 -g1提供的基因组的端粒信息
# -cen2 -g2提供的基因组的着丝粒信息
# -tel2 -g2提供的基因组的端粒信息
# -TE1 -g1提供基因组的TE密度信息
# -TE2 -g2提供基因组的TE密度信息
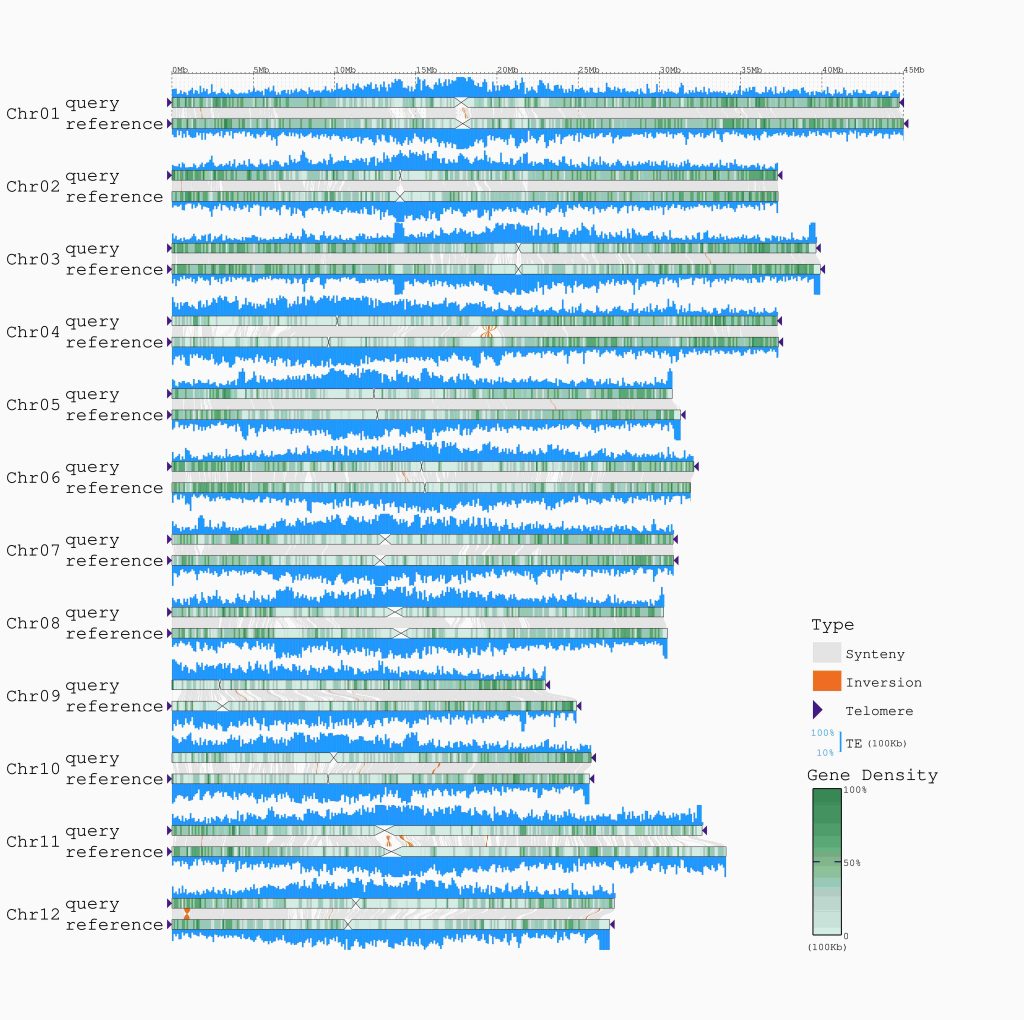
继续添加基因密度信息
					GenomeSyn -g1 rice_MH63.fa -g2 rice_ZS97.fa \
-cf1 rice_MH63vsZS97.delta.filter.coords \
-cen1 rice_MH63_centromere.bed -tel1 rice_MH63_telomere.bed \
-o1 Only_genome_add_Two_Telomere_Centromere_TE.svg \
-cen2 rice_ZS97_centromere.bed -tel2 rice_ZS97_telomere.bed \
-TE1 rice_MH63_repeat.bed -TE2 rice_ZS97_repeat.bed \
-GD1 rice_MH63_nonTEgene.gff3 -GD2 rice_ZS97_nonTEgene.gff3

# -cf1 MUMmer的比对结果
# -cen1 -g1提供的基因组的着丝粒信息
# -tel1 -g1提供的基因组的端粒信息
# -cen2 -g2提供的基因组的着丝粒信息
# -tel2 -g2提供的基因组的端粒信息
# -TE1 -g1提供基因组的TE密度信息
# -TE2 -g2提供基因组的TE密度信息
# -GD1 -g1提供基因组的基因密度信息
# -GD2 -g2提供基因组的基因密度信息
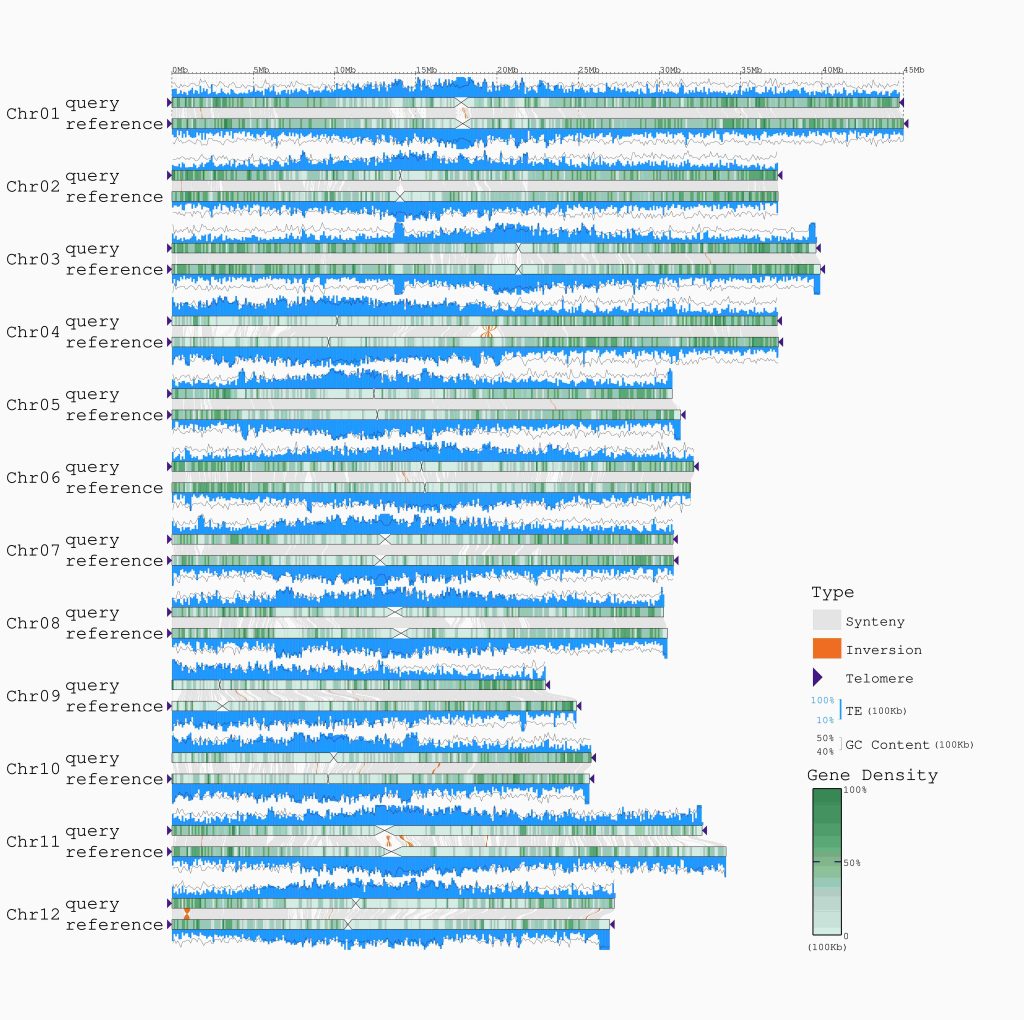
继续添加GC含量信息
					GenomeSyn -g1 rice_MH63.fa -g2 rice_ZS97.fa \
-cf1 rice_MH63vsZS97.delta.filter.coords \
-cen1 rice_MH63_centromere.bed -tel1 rice_MH63_telomere.bed \
-o1 Only_genome_add_Two_Telomere_Centromere_TE.svg \
-cen2 rice_ZS97_centromere.bed -tel2 rice_ZS97_telomere.bed \
-TE1 rice_MH63_repeat.bed -TE2 rice_ZS97_repeat.bed \
-GD1 rice_MH63_nonTEgene.gff3 -GD2 rice_ZS97_nonTEgene.gff3 \
-GC1 rice_MH63_GC_10000.bed -GC2 rice_ZS97_GC_10000.bed \
-GC_win 100000

# -cf1 MUMmer的比对结果
# -cen1 -g1提供的基因组的着丝粒信息
# -tel1 -g1提供的基因组的端粒信息
# -cen2 -g2提供的基因组的着丝粒信息
# -tel2 -g2提供的基因组的端粒信息
# -TE1 -g1提供基因组的TE密度信息
# -TE2 -g2提供基因组的TE密度信息
# -GD1 -g1提供基因组的基因密度信息
# -GD2 -g2提供基因组的基因密度信息
# -GC1 -g2提供基因组的GC含量信息
# -GC2 -g2提供基因组的GC含量信息
# -GC_win GC含量滑动窗口的最小长度
还可以高亮显示基因组中的PAV和NLR区域,但是可能用到的不是特别多
					GenomeSyn -g1 rice_MH63.fa -g2 rice_ZS97.fa \
-cf1 rice_MH63vsZS97.delta.filter.coords \
-cen1 rice_MH63_centromere.bed -tel1 rice_MH63_telomere.bed \
-o1 Only_genome_add_Two_Telomere_Centromere_TE.svg \
-cen2 rice_ZS97_centromere.bed -tel2 rice_ZS97_telomere.bed \
-TE1 rice_MH63_repeat.bed -TE2 rice_ZS97_repeat.bed \
-GD1 rice_MH63_nonTEgene.gff3 -GD2 rice_ZS97_nonTEgene.gff3 \
-GC1 rice_MH63_GC_10000.bed -GC2 rice_ZS97_GC_10000.bed \
-GC_win 100000 \
-PAV1 rice_MH63_PAV.bed -PAV2 rice_ZS97_PAV.bed \
-NLR1 rice_MH63_NLR.bed -NLR2 rice_ZS97_NLR.bed

# -cf1 MUMmer的比对结果
# -cen1 -g1提供的基因组的着丝粒信息
# -tel1 -g1提供的基因组的端粒信息
# -cen2 -g2提供的基因组的着丝粒信息
# -tel2 -g2提供的基因组的端粒信息
# -TE1 -g1提供基因组的TE密度信息
# -TE2 -g2提供基因组的TE密度信息
# -GD1 -g1提供基因组的基因密度信息
# -GD2 -g2提供基因组的基因密度信息
# -GC1 -g2提供基因组的GC含量信息
# -GC2 -g2提供基因组的GC含量信息
# -GC_win GC含量滑动窗口的最小长度
# -PAV1 -g1提供基因组的PAV位置信息
# -PAV2 -g2提供基因组的PAV位置信息
# -NLR1 -g1提供基因组的NLR位置信息
# -NLR2 -g1提供基因组的NLR位置信息

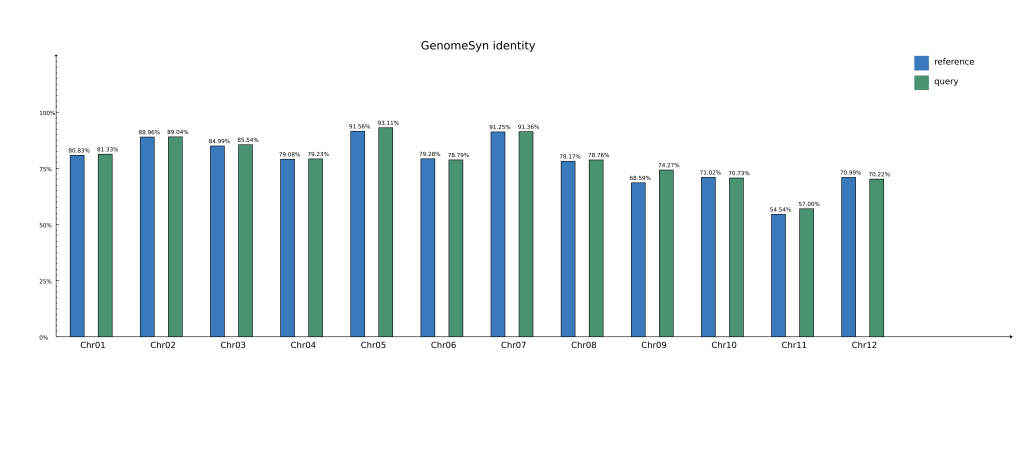
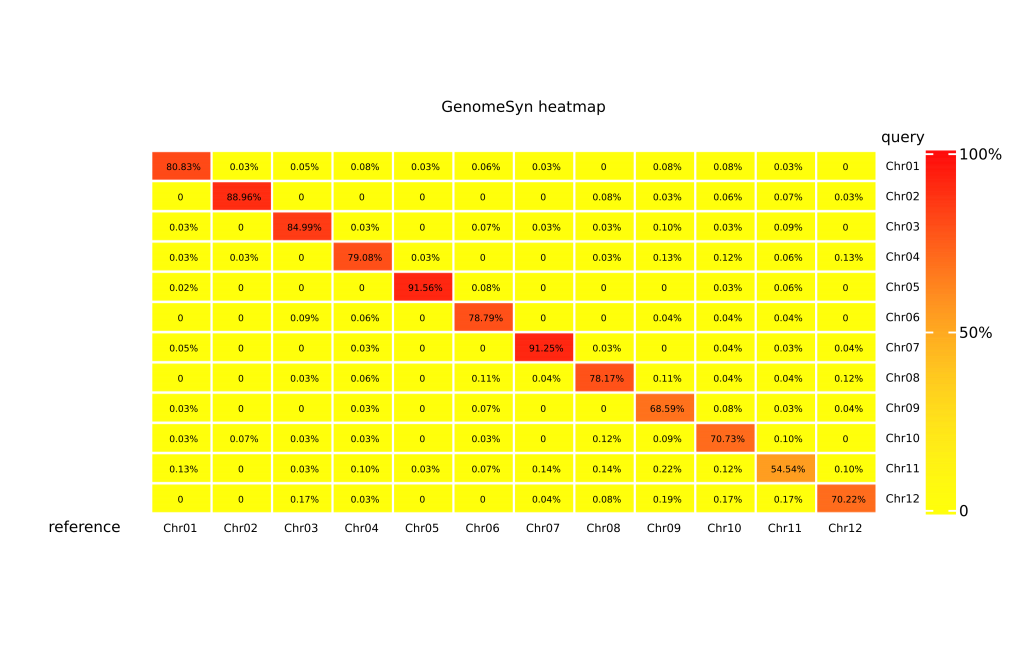
还可以通过调整-t参数,输出类似jcvi的共线性图以及相似性热图和柱状图
					GenomeSyn -g1 rice_MH63.fa -g2 rice_ZS97.fa \
-cf1 rice_MH63vsZS97.delta.filter.coords \
-cen1 rice_MH63_centromere.bed -tel1 rice_MH63_telomere.bed \
-o1 Only_genome_add_Two_Telomere_Centromere_TE.svg \
-cen2 rice_ZS97_centromere.bed -tel2 rice_ZS97_telomere.bed \
-TE1 rice_MH63_repeat.bed -TE2 rice_ZS97_repeat.bed \
-GD1 rice_MH63_nonTEgene.gff3 -GD2 rice_ZS97_nonTEgene.gff3 \
-GC1 rice_MH63_GC_10000.bed -GC2 rice_ZS97_GC_10000.bed \
-GC_win 100000 \
-PAV1 rice_MH63_PAV.bed -PAV2 rice_ZS97_PAV.bed \
-NLR1 rice_MH63_NLR.bed -NLR2 rice_ZS97_NLR.bed \
-t 4

# -cf1 MUMmer的比对结果
# -cen1 -g1提供的基因组的着丝粒信息
# -tel1 -g1提供的基因组的端粒信息
# -cen2 -g2提供的基因组的着丝粒信息
# -tel2 -g2提供的基因组的端粒信息
# -TE1 -g1提供基因组的TE密度信息
# -TE2 -g2提供基因组的TE密度信息
# -GD1 -g1提供基因组的基因密度信息
# -GD2 -g2提供基因组的基因密度信息
# -GC1 -g2提供基因组的GC含量信息
# -GC2 -g2提供基因组的GC含量信息
# -GC_win GC含量滑动窗口的最小长度
# -PAV1 -g1提供基因组的PAV位置信息
# -PAV2 -g2提供基因组的PAV位置信息
# -NLR1 -g1提供基因组的NLR位置信息
# -NLR2 -g1提供基因组的NLR位置信息
# -t 绘图的模式,4为最全的模式,输出所有的结果图

结语
总的来讲,GenomeSyn是一款可视化基因共线性很优秀的软件吗,比同类型的Syri+Plotsr确实简单了不少。