1. 前言
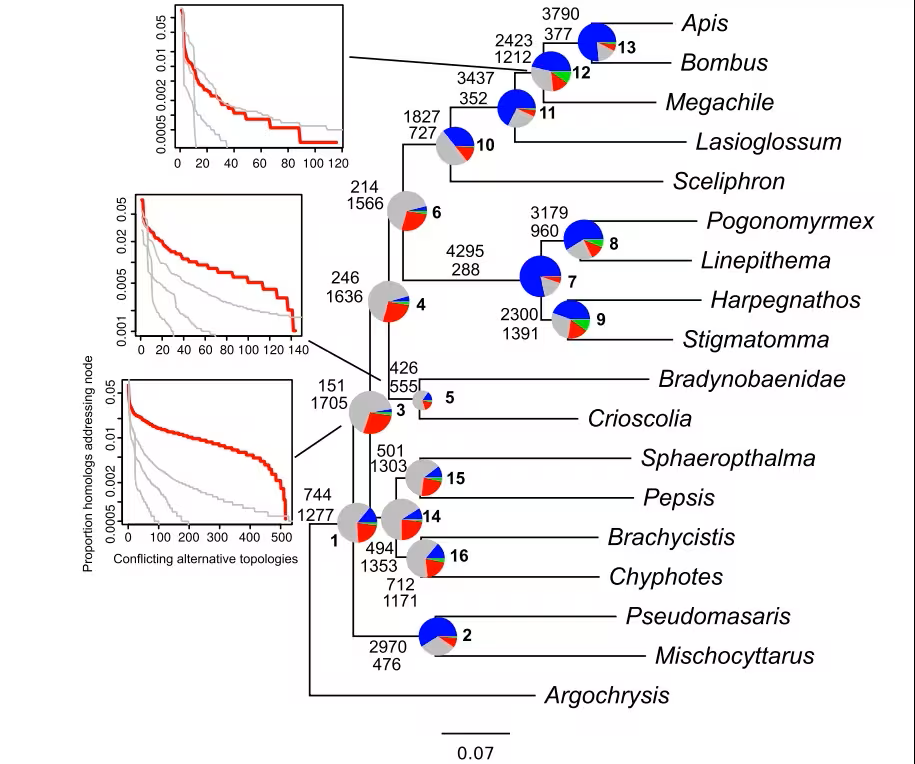
最近受了老师的指派,学习系统发育分析部分,虽然大部分硕士的时候都做过,但是现在看来有些分析确实可以优化一下吗。今天就来重新学习并且优化一下系统发育冲突分析。这次新学习的时候引入了一个新的方法,可以通过合并两次phyparts的结果,将基因树上丢失和低于支持率的分支进一步细化,并且根据比值绘制饼图。
2. 软件下载
					mamba create -n phyparts
mamba activate phyparts
mamba install conda-forge::maven
git clone https://gitee.com/yen233/phyparts.git
./mvn_cmdline.sh
3. 输入文件
输入文件就是两个,(1)单基因树,要求是带有支持率并且定根(2)物种树,同样要求定根
4. 运行
					java -jar script/target/phyparts-0.0.1-SNAPSHOT-jar-with-dependencies.jar -a 1 -v -s 50 -d gene_trees -m RAxML_bestTree.tre -o mo
java -jar /mnt/linxh/software/phyparts/target/phyparts-0.0.1-SNAPSHOT-jar-with-dependencies.jar -a 0 -v -d gene_trees -m RAxML_bestTree.tre.rooted.newick -o mo1

# -a 模式
# -s 支持率的截断值
# -d 基因树
# -m 物种树
使用R将两次的结果合并
					library(phytools)

read.tree("A_0_No_BS_RT_all_homologs.concon.tre")->No_bs #Tree file output from phyparts of concordance (-a 0) anlysis with out support filtering (-s)
read.tree("A_1_BS_50_RT_all_homologs.concon.tre")->bs_full_concordance #Tree file output from phyparts of full concordance anlysis (-a 1) with support filtering (e.g. Bootstrap 50; -s 50)

total_no_bs<-No_bs[[1]] # get a tree to add total node numbers

total_no_bs$node.label<-mapply("+",as.numeric(No_bs[[1]]$node.label), as.numeric(No_bs[[2]]$node.label)) #get total number of nodes
total_no_bs$node.label[is.na(total_no_bs$node.label)] <- "" #remove NA values
total_no_bs$node.label[total_no_bs$node.label=="0"]<-"" #remove 0 values. to avoid divisions by zero.


append(bs_full_concordance, total_no_bs, after=2)-> full_concordance_and_total_nodes #append tree with total number of nodes to tree file output from phyparts of full concordance anlysis

write.tree(full_concordance_and_total_nodes, file = "A_1_BS_50_RT_all_homologs.concon.tre") #write tree. this will replace to orignal file.
可视化(删除缺失的物种)
python /mnt/linxh/software/paralog_scripts/phypartspiecharts_proportional.py RAxML_bestTree.tre.rooted.newick mo

可视化(缺失和低于支持率阈值用不同的颜色区分)
python /mnt/linxh/software/paralog_scripts/phypartspiecharts_missing_uninformative.py RAxML_bestTree.tre.rooted.newick mo 538
